Common problems: analytics
⚠️ Required permissions: at least one statistics permission. The results displayed may also vary depending on the permissions and scope defined in your profile. To learn more, see Manage access to statistics.
On this page
- Figures remain unchanged after changing the period
- No percentage change is displayed
- Selecting a department resets the selected groups
- Displayed columns differ between administrators
- The Success rate changes depending on the tab
- A group’s Completion rate and Success rate can differ significantly
- A rate exceeds 100%
- Certifications obtained does not represent the number of certified learners
- A certificate obtained before the selected period may appear as “Not obtained”
- Learn more
Common issues: statistics
⚠️ Required permissions: at least one statistics permission. The results displayed may also vary depending on the permissions and scope defined in your profile. To learn more, see Manage access to statistics.
This article covers the most common discrepancies you may encounter when analysing statistics. For each situation, it explains what the indicator actually measures and which filters, settings or calculation rules may account for the difference.
In most cases, these discrepancies are caused by the scope of the data or the way an indicator is calculated, rather than by a data issue.
Figures remain unchanged after changing the period
Widgets in the Global Statistics tab follow the selected period and applied filters.
The summary on the right works differently: it shows cumulative data from the beginning of the account’s history, as indicated by the message “Track how your data has evolved since day one.”
It includes three indicators:
- Connected learners;
- Capsules started;
- Training hours.
⚠️ Do not compare these three indicators directly with filtered widgets. They do not use the same data scope, which explains the differences you may see.
No percentage change is displayed
The percentage change and the Compared with the previous period message are displayed only when data is available for the comparison period.
If no data is available for that period, the widget only shows the current value, without a percentage change or comparison arrow.
Before assuming that something is missing, check whether there was activity during the previous period. If needed, select a longer period.
Selecting a department resets the selected groups
When you select a department, any learner groups already selected are automatically removed from the filter. This also happens when switching from one department to another.
The Only content from selected groups option is also disabled because it depends on a group selection. No warning is displayed when this reset occurs.
💡 Select the department first, then the groups. Before interpreting the results, check the summary of applied filters.
The Only content from my department or the selected department option appears only when you are working from a department or when a department has been selected in the filters.
Check its status in the applied filter summary before comparing two results.
To learn more, see Filters and audiences.
Displayed columns differ between administrators
The columns displayed in a statistics table are customized for each user. Your selection is saved individually for each table.
Two administrators can therefore open the same screen and see different columns without any global setting having changed.
To display a column you need:
- Open the relevant table, for example Learners / Groups > Learners.
- Click Columns in the top-right corner of the table.
- Search for the column using Search for a column, or browse the Displayed in table and Hidden from table sections.
- Select the column you want to display. It is added to the table immediately, with no confirmation step.
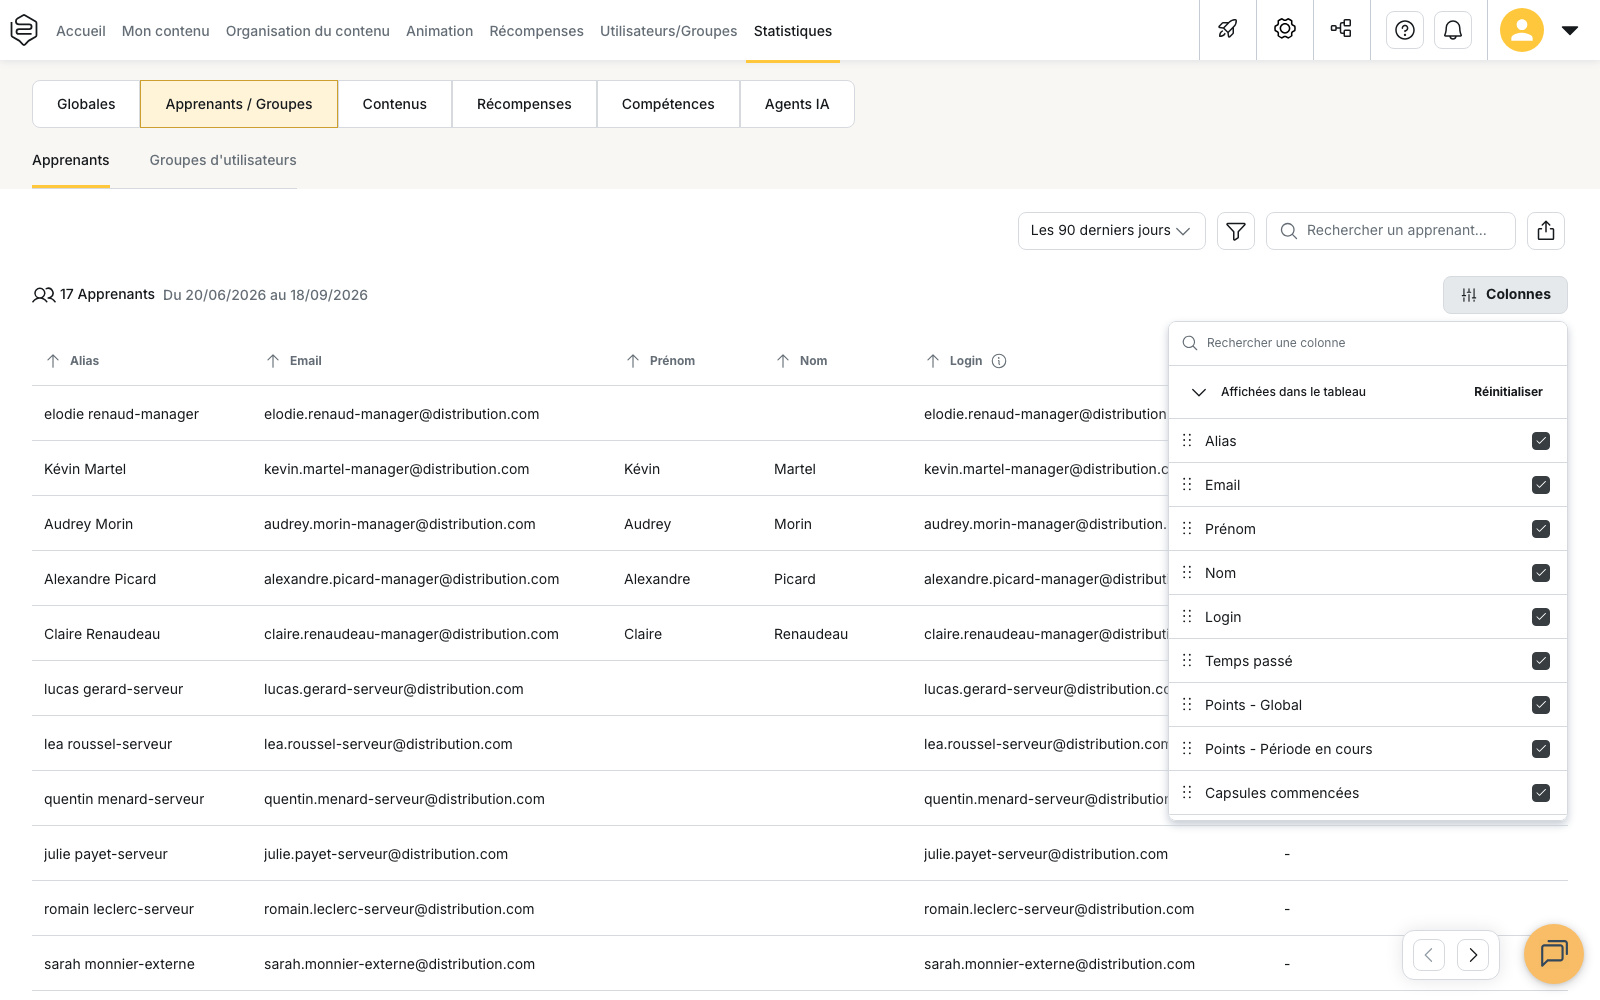
From the same panel:
- Show all adds all available columns;
- Reset restores the default table configuration;
- columns in Displayed in table can be reordered by dragging and dropping them.
💡 Before assuming that a column is unavailable, make sure you are viewing the same sub-tab. The Learners and User groups views do not provide the same columns.
The Success rate changes depending on the tab
The same label can refer to a different calculation depending on the table.
In the Learners sub-tab, Success rate - Unique represents the share of distinct capsules passed by the learner. If the learner passes the same capsule several times, it is counted only once.
In the User groups sub-tab, Success rate is calculated by dividing the number of capsules passed by the number of capsules completed, as indicated in its tooltip: Capsules passed / Capsules completed.
⚠️ Do not compare these two rates directly. They use different populations and calculation methods.
A group’s Completion rate and Success rate can differ significantly
These two indicators are not calculated in the same way.
The Completion rate corresponds to the share of distinct capsules completed out of distinct capsules started. Each capsule is therefore counted only once per learner, even if it was started or completed several times.
The Success rate, on the other hand, corresponds to the number of capsules passed divided by the number of capsules completed.
A group can therefore show, for example, a 50% Completion rate and a 90% Success rate. These values are consistent and cannot be derived from one another.
To learn more, see What does each indicator measure?.
A rate exceeds 100%
Both values used to calculate the Completion rate are limited to the selected period.
A capsule that was started before the beginning of the period but completed during it is therefore counted as completed without being counted as started.
When several learners in the same group are in this situation, the Completion rate can exceed 100%.
This is not a display issue. The rate compares capsules completed during the period with capsules started during the same period. It does not directly measure the share of learners who completed their content.
Certifications obtained does not represent the number of certified learners
The two certificate-related indicators measure different things.
In the Learners sub-tab, Certificates obtained counts the number of distinct certificates obtained by each learner. If a learner obtains the same certificate several times, it is counted only once.
In the User groups sub-tab, Certifications obtained counts all certificate awards within the group during the selected period, including renewals.
⚠️ These two indicators cannot be added together, and neither directly represents the number of certified learners.
A certificate obtained before the selected period may appear as “Not obtained”
The selected period also applies to the Status displayed in a certificate’s details.
If the certificate was obtained before the beginning of the selected period, that award is not included and the status is displayed as Not obtained.
Before concluding that a certificate has not been obtained, select a wider period and check the dates shown in the applied filter summary.
To learn more, see Rewards statistics.
Learn more
- What does each indicator measure?: understand the differences between Unique and Global, or between Completed and Passed, which explain many of these discrepancies.
- Filters and audiences: understand how the period, department and inclusion options affect the data being analysed.
- Learner and group statistics: understand the indicators available in both sub-tabs and view detailed learner data.
- Common issues: content distribution: identify distribution issues when a low rate is mainly caused by content that learners cannot access or have not received.