Getting started with the statistics profile
Getting started with the statistics profile
You are in the right place if
Your access was created from the Statistics profile, one of the five predefined profiles of the Beedeez back office. Anyone holding this profile only has access to the statistics of the platform.
You don’t have change anything: no content creation, no distribution, no animation, no account configuration.
This profile is often given to management control, the quality department, an auditor, or anyone who produces reporting without acting on the platform.
What the profile covers
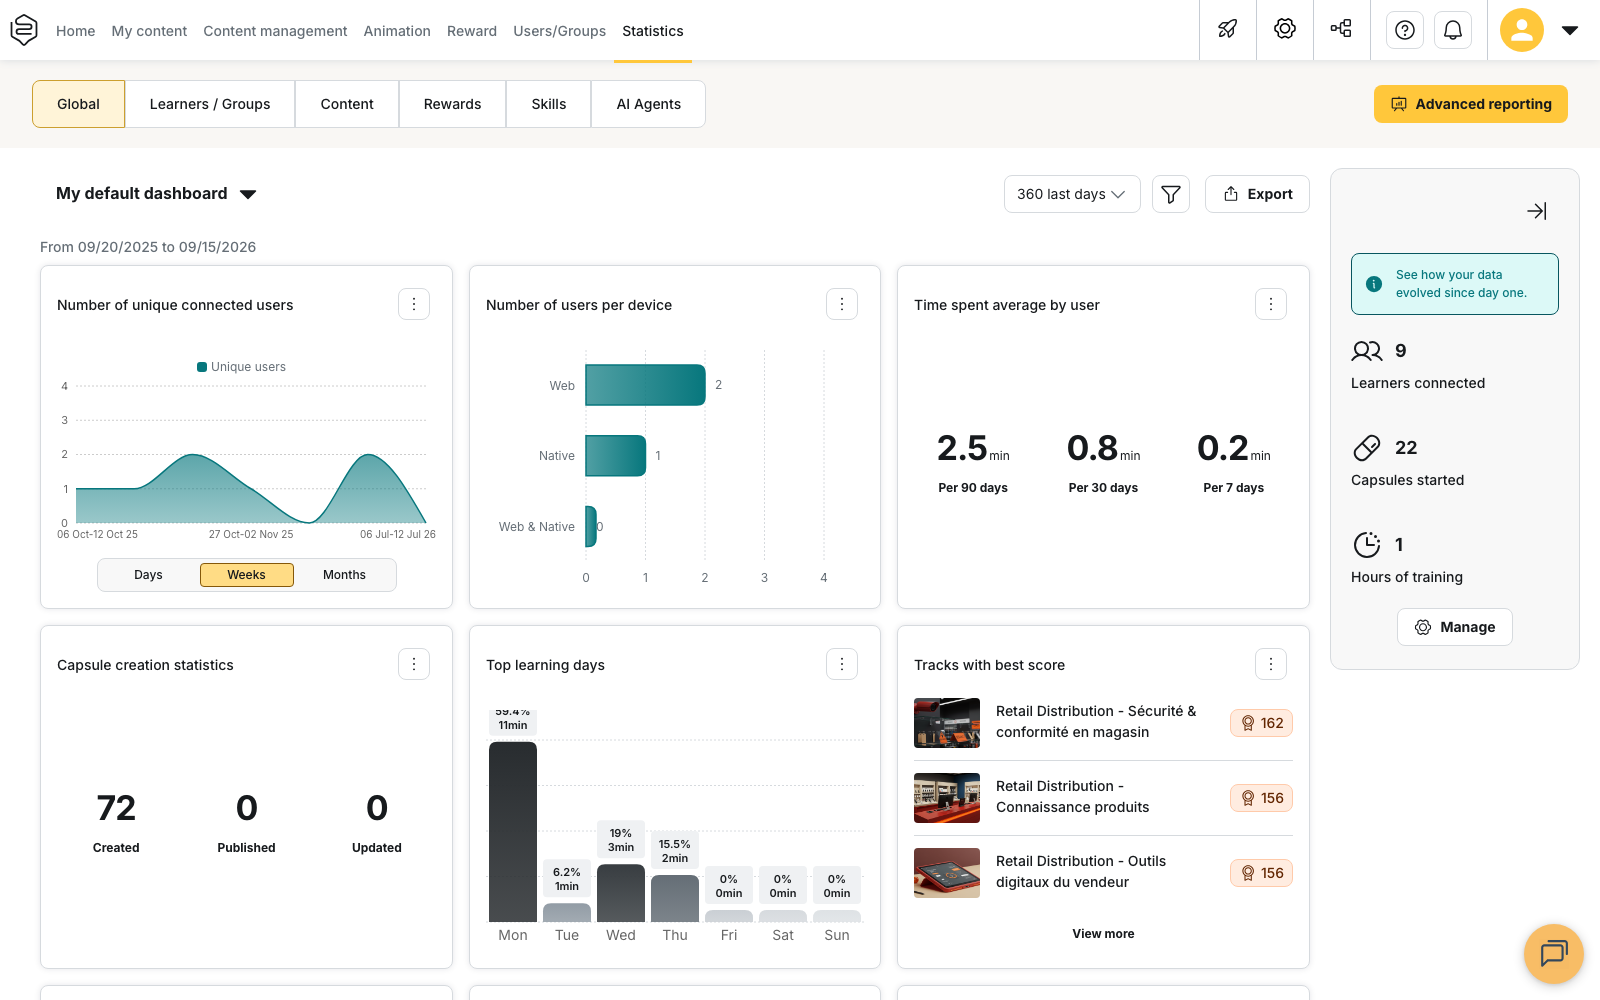
You reach the Statistics menu, with the tabs:
- Global,
- Learners / Groups,
- Content,
- Skills and AI Agents when those options are enabled on your account.
The Content tab splits according to the rights granted to your access: Capsules, Tracks, Tips when the option is enabled on the account, and the hot / cold evaluations, which appear at the same time as capsule statistics.
Depending on the screen, you can filter the data, build your own dashboards and export.
What the profile does not cover
Everything else. The back office will look almost empty next to what your colleagues describe: the editing, distribution, animation and configuration screens do not appear on your side. Nothing is greyed out, because a missing right is invisible. See Why can’t I see this feature?
Two less obvious absences, inside the statistics themselves:
- the Rewards tab (badges and certificates). It appears with an animation right on badges or on certificates, which this profile does not grant;
- Product sheets statistics. That right exists in the authorization templates, but this profile doesn’t grant it either.
The traps to know before your first report
“Completed” does not mean “passed”. Reaching the end of a capsule and obtaining the required score are two distinct indicators. Depending on the table you open, the Success rate is not even calculated on the same basis:
- on capsules, it compares learners who passed against learners who started;
- on groups, it compares capsules passed against capsules completed.
Counted once, or counted every time. In the learners table, one column counts each capsule once regardless of how many times a learner opened it, while another counts every attempt. Never mix the two within the same table.
Read Indicator definitions before running any export. It’s the first article you should read.
The perimeter trap
⚠️ The Statistics profile says what you may read; your department says what you read it on. Two people holding the same profile can produce two different exports of the same report without either of them being wrong: the figures depend on the department you look from and on the filters applied. Always record, next to a file, who produced it and with which filters.
And know this from the start: filters aren’t shared between users. Common filters are common across tables, not across people. A filter can only be reused by the person who created it. If a report needs to be reproducible by someone else, its definition has to be written down in your procedure.
Where to start
- Read the indicator definitions. Several columns carry the same name without counting the same thing: knowing them before producing a figure saves you from correcting it afterwards.
- Run a test export and check that the volumes look plausible to you.
- Ask whoever created your access for your exact perimeter: your department, and any restrictions in your template. You will need both to interpret everything else.
Going further
- Indicator definitions: what each figure counts, before it goes into a report.
- Exports and reporting: the exports available, screen by screen.
- Who sees which statistics: why your figures and a colleague’s can differ.
- Understanding custom permissions: if your access doesn’t exactly match this page.