Dashboards
⚠️ Required permissions: access to the Global tab depends on the access level defined for Global Statistics in your permission model. Any level other than No global statistics gives you access.
Dashboards
⚠️ Required permissions: access to the Global tab depends on the access level defined for Global Statistics in your permission model. Any level other than No global statistics gives you access.
No additional permission is required to create or edit a dashboard.
A dashboard is made up of widgets that you can add and arrange freely in the Global tab.
The data displayed depends on the selected period and the filters applied above the dashboard. The From … to … label shows the dates actually included in the calculations.
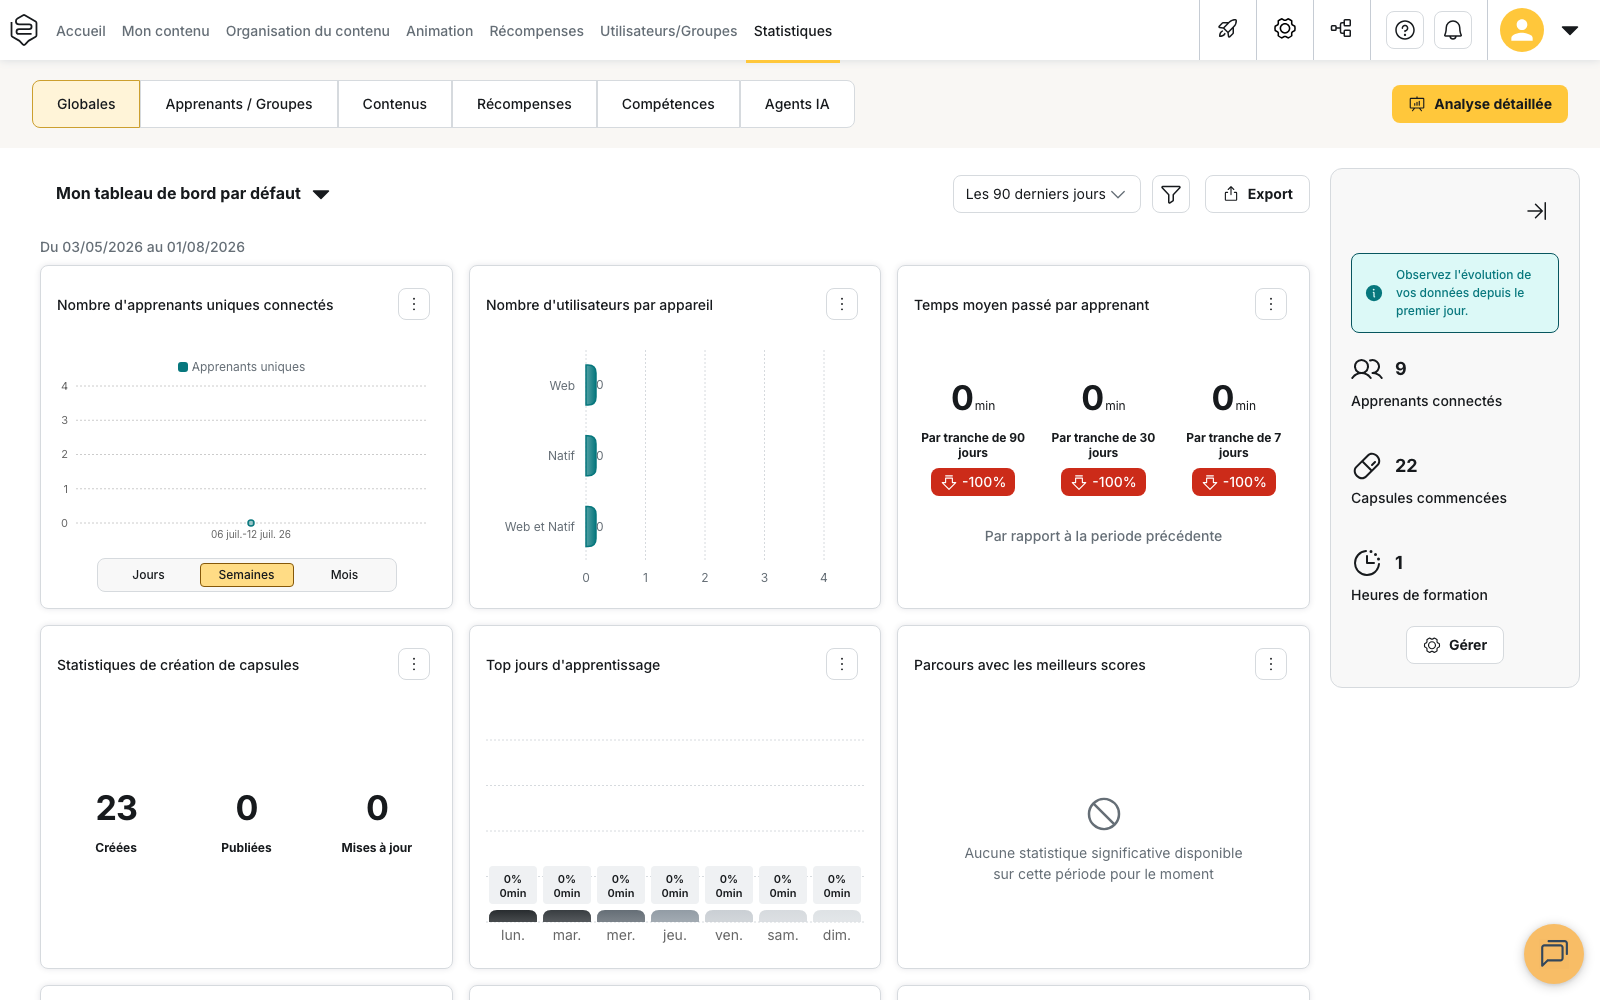
Open your dashboard list
In the top-left corner of the tab, a button displays the name of the currently selected dashboard. Click it to open your dashboard list.
From this list:
- click the pencil icon to open a dashboard in edit mode;
- click Create a dashboard at the bottom of the list to create a new one.
If you have not created a dashboard yet, My default dashboard is displayed automatically. It contains ten preconfigured widgets that you can remove, move or resize.
The default dashboard cannot be renamed: the Dashboard name field is locked. The Delete button is available only for dashboards you have created yourself.
⚠️ Widget-specific settings are not saved on the default dashboard. For example, a segmentation or learning path selected in a widget is reset when you reload the page. Widget position, size and removal are saved.
To keep the settings selected within your widgets, create your own dashboard.
Create a dashboard
In the configuration panel, enter a Dashboard name, then click a widget in the left-hand column to add it. Use the trash icon to remove a widget.
The Create dashboard button remains inactive until at least one widget has been added and the dashboard has a valid name. A name containing only spaces is considered empty.
When editing an existing dashboard, the button changes to Update.
The Close button lets you leave the panel without deleting the dashboard. The Delete button opens the Delete dashboard window, which warns you that the action cannot be undone.
Tips
- You can add the same widget more than once and configure each instance differently, for example to compare two groups side by side.
- Widget order and size are changed directly from the dashboard, not from the configuration panel.
Choose your widgets
The panel groups widgets into five sections, displayed in the following order. By default, only four widgets are shown in each section. Click Show more to display the rest.
- Capsules: Capsule content types, Capsule creation statistics, Top-rated capsules, Number of unique capsules, Number of capsule attempts, Average number of capsules started per learner, Global completion rate, Learning velocity, Content drop-off rate and Most viewed capsules.
- Learners: Users by device, Connection time, Number of unique connected users, Top learners, Average time spent per learner, Learner activity rate, Top learning days, User retention rate, Platform adoption rate and Total time spent.
- Learning paths: Learning path statistics, Most viewed learning paths, Most successful learning paths, Learning paths with the highest scores and Learning paths with the most time spent.
- Tips: Most viewed tips and Most useful tips.
- Coaching: Global coaching statistics and Skill level distribution.
⚠️ Some widgets are available only if your account contains user data that can be used for segmentation. These include Detailed learner activity rate, Detailed success percentage, Detailed average time spent per learner, Detailed number of unique capsules, Detailed number of capsule attempts by segmentation and Tips created.
Arrange the widgets
Hover over a widget to display its controls:
- the Drag to move handle in the top-left corner lets you reposition the widget;
- the resize handle in the bottom-right corner lets you change its size.
Changes to position and size are saved automatically when you release the widget. No confirmation button is required.
The ⋮ menu on each widget provides the following actions: Information, Export Excel, Export PDF and Remove widget.
⚠️ On screens narrower than 1,000 pixels, widgets are displayed in a single column. Changes made to their position in this view are not saved.
Compare periods
Ten widgets display a percentage change under Compared with the previous period:
- Average time spent per learner;
- Total time spent;
- Platform adoption rate;
- Number of unique capsules;
- Number of capsule attempts;
- Average number of capsules started per learner;
- Capsule creation statistics;
- Global completion rate;
- Tips created;
- Global coaching statistics.
The other widgets do not provide a comparison with the previous period.
The comparison period is a window of the same length immediately preceding the selected period. With a Custom period, this change is not calculated. If no data is available for the comparison period, the comparison is not displayed.
Read the account summary
⚠️ The summary does not take the selected period or applied filters into account. The Connected learners, Capsules started and Training hours indicators are cumulative from the beginning of the account’s history, as indicated by the message “Track how your data has evolved since day one.”
These three values should therefore not be compared directly with the values shown in the widgets.
The Manage button opens the statistics customization settings, not the dashboard configuration. It is available only to profiles with the Edit customization permission.
Good to know
Dashboards are personal. Each dashboard belongs to the person who created it. Other administrators cannot see it, and it cannot be shared directly with a colleague.
Dashboards cannot be duplicated. Unlike filters, there is no action for copying a dashboard. To create a similar one, you must add and configure the widgets again.
Dashboards depend on the department you are working from. When you switch departments, the list of available dashboards changes as well.
⚠️ The selected department also affects the data included in the widgets. The content counted is restricted according to the department from which you are viewing Statistics. To understand exactly how this works, see Filters and audiences.
Learn more
- Filters and audiences: understand how the period, groups and advanced filters affect the data displayed in widgets.
- What does each indicator measure?: understand exactly how the indicators displayed in dashboards are calculated.
- Who can see which statistics?: understand how permissions and their scope can cause different administrators to see different data.
- Exports and reporting: learn how to export a dashboard to PDF or a widget’s data to Excel.