Global analytics
⚠️ Required permissions: you must have the Global Statistics permission. Without it, the Global tab does not appear, and you are taken to the first Statistics tab you are allowed to access.
Global statistics
⚠️ Required permissions: you must have the Global Statistics permission. Without it, the Global tab does not appear, and you are taken to the first Statistics tab you are allowed to access.
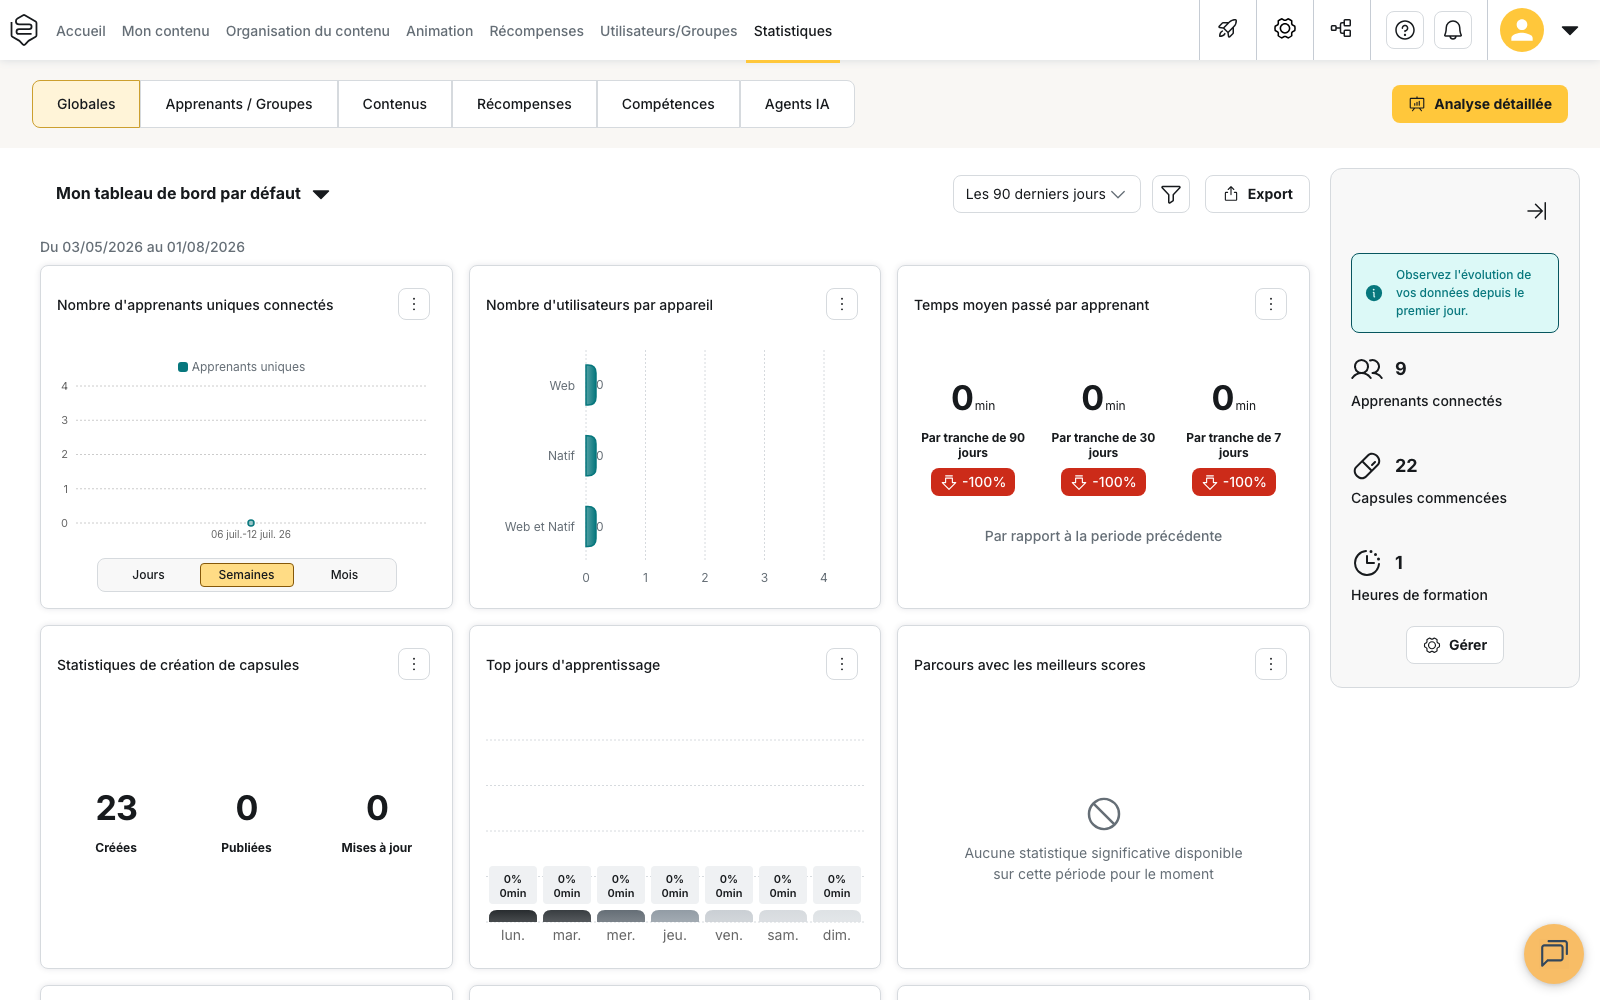
The Global tab is the first tab in Statistics. It contains two separate areas:
- a dashboard made up of widgets, which is affected by the selected period and filters;
- a summary on the right-hand side with three counters calculated from the beginning of the account’s history.
Confusing these two areas is one of the main reasons why figures on this screen may appear to differ.
Choose the period
The period selector provides the following options:
- Last 7 days;
- Last 30 days;
- Last 90 days;
- Last 360 days;
- Custom period.
There is no option covering the full account history: the widget dashboard is always calculated over a defined period.
When you select Custom period, two additional fields appear next to the selector: Start date and End date.
When you open the tab, the period applied is the one defined in the active filter or, if no filter is active, in the default filter. It may therefore differ from the last period you selected in another Statistics tab.
Check the period shown in the filter bar before interpreting or exporting the data.
Build the widget dashboard
The dashboard displays the name of the current dashboard. Until you create another one, this is My default dashboard.
Widgets can cover several areas, including learners, capsules, learning paths, tips and coaching.
Some widgets also show a change compared with the previous period.
To choose widgets, rearrange them and create your own dashboards, see Dashboards.
Read the account summary
The Connected learners, Capsules started and Training hours indicators include data from the beginning of the account’s history, as indicated by the message: “Track how your data has evolved since day one.”
Training hours are rounded to the nearest hour.
⚠️ Do not compare these three indicators directly with the widgets. The summary does not take the selected period or dashboard filters into account. Differences between the two areas are therefore expected.
The summary can be collapsed. Use Collapse summary to give more space to the dashboard, and Expand summary to open it again.
Depending on your account configuration, the summary may already be collapsed when you open the page.
The Manage button opens the customization page for these counters. It is available only if your permission model allows you to edit platform customization settings.
Filter the widgets
The filter bar lets you narrow down the data displayed using several criteria:
- Departments;
- Period;
- Learner groups;
- Include deactivated learners;
- Only show content from my department or the selected department.
Each filter and its effect on the displayed data is explained in Filters and audiences.
You can save a combination of filters and reuse it later from the filter selector.
💡 Tip: name a saved filter after the population and period it covers. This makes it easier to identify when several filters are available.
For the exact definition of each indicator displayed in the widgets, see Statistics indicator definitions.
Export the data
The Export button generates a PDF of the current dashboard, including the widgets displayed and the selected period.
The button remains inactive until at least one widget is displayed.
The Detailed analysis button, located in the top-right corner, is available only in this tab and only if your account includes advanced exports.
It opens the Advanced export options panel, where you can generate an Excel file containing more detailed data than the PDF export.
To learn more about both export options, see Exports and reporting.
Learn more
- Dashboards: choose which widgets to display, arrange them and create your own dashboards.
- Filters and audiences: understand how each filter affects the data displayed.
- Statistics indicator definitions: understand exactly what each indicator measures.
- Exports and reporting: understand what Export and Detailed analysis produce and how they differ.