Learner and group analytics
⚠️ Required permissions: the User Statistics permission, defined in the permission model. It can provide access to all learners, groups supervised by the administrator, a restricted selection of groups, or no data at all.
Learner and group statistics
⚠️ Required permissions: the User Statistics permission, defined in the permission model. It can provide access to all learners, groups supervised by the administrator, a restricted selection of groups, or no data at all.
To understand exactly what each access level includes, see Who can see which statistics?.
This report lets you track the progress of each learner or user group. It is available from Statistics > Learners / Groups and provides two views:
- Learners: one row per learner;
- User groups: one row per group.
For the exact definition of the data displayed in each column, see What does each indicator measure?.
Choose a sub-tab
Two sub-tabs are available under Learners / Groups: Learners and User groups. Select the one you want to view.
In the User groups sub-tab, the Group by selector lets you choose how the data is grouped. The number of groups matching the current selection is also displayed on screen.
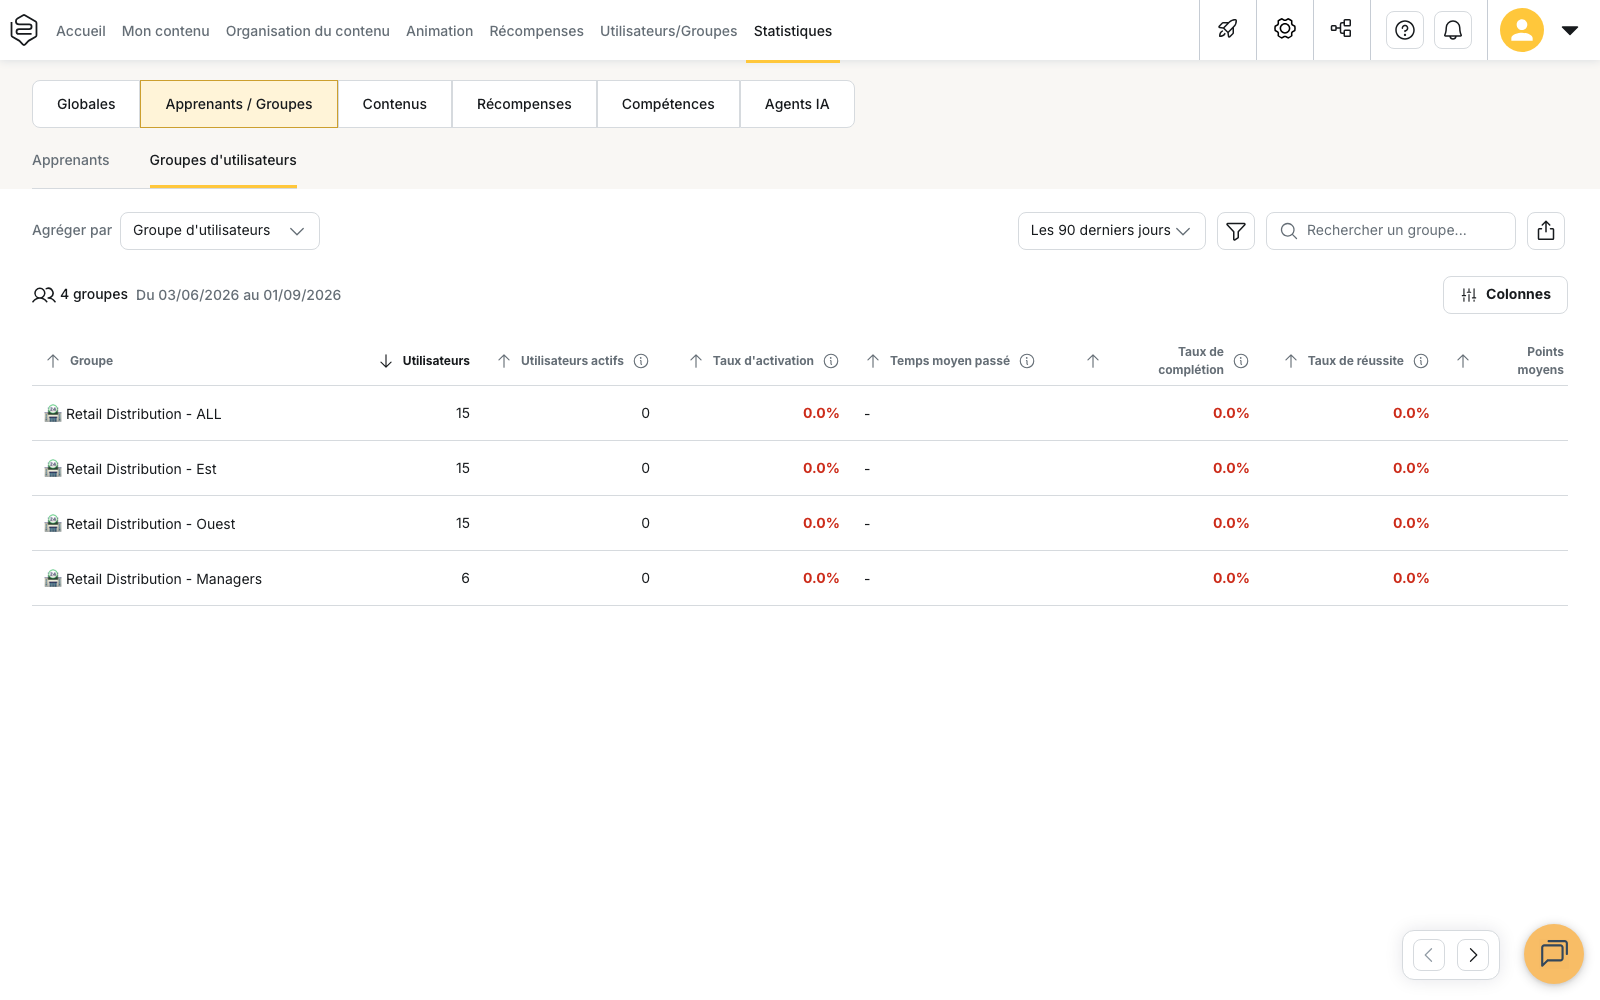
Both sub-tabs provide the same options at the top of the screen:
- a period selector, set to Last 90 days by default. The dates included are shown next to the number of rows displayed;
- a search field, which searches learners or groups depending on the selected sub-tab;
- a button to export the data to Excel;
- the Columns button, which lets you choose which columns are displayed in the table.
Export the report
The export uses the report exactly as it is configured on screen: applied filters and search, visible columns and current sort order.
It includes all rows matching these criteria, not only those currently visible on screen. In the Excel file, the header row remains frozen and an automatic filter is added to each column.
💡 Before exporting, check your current view: the selected settings directly determine what is included in the file.
Choose which columns to display
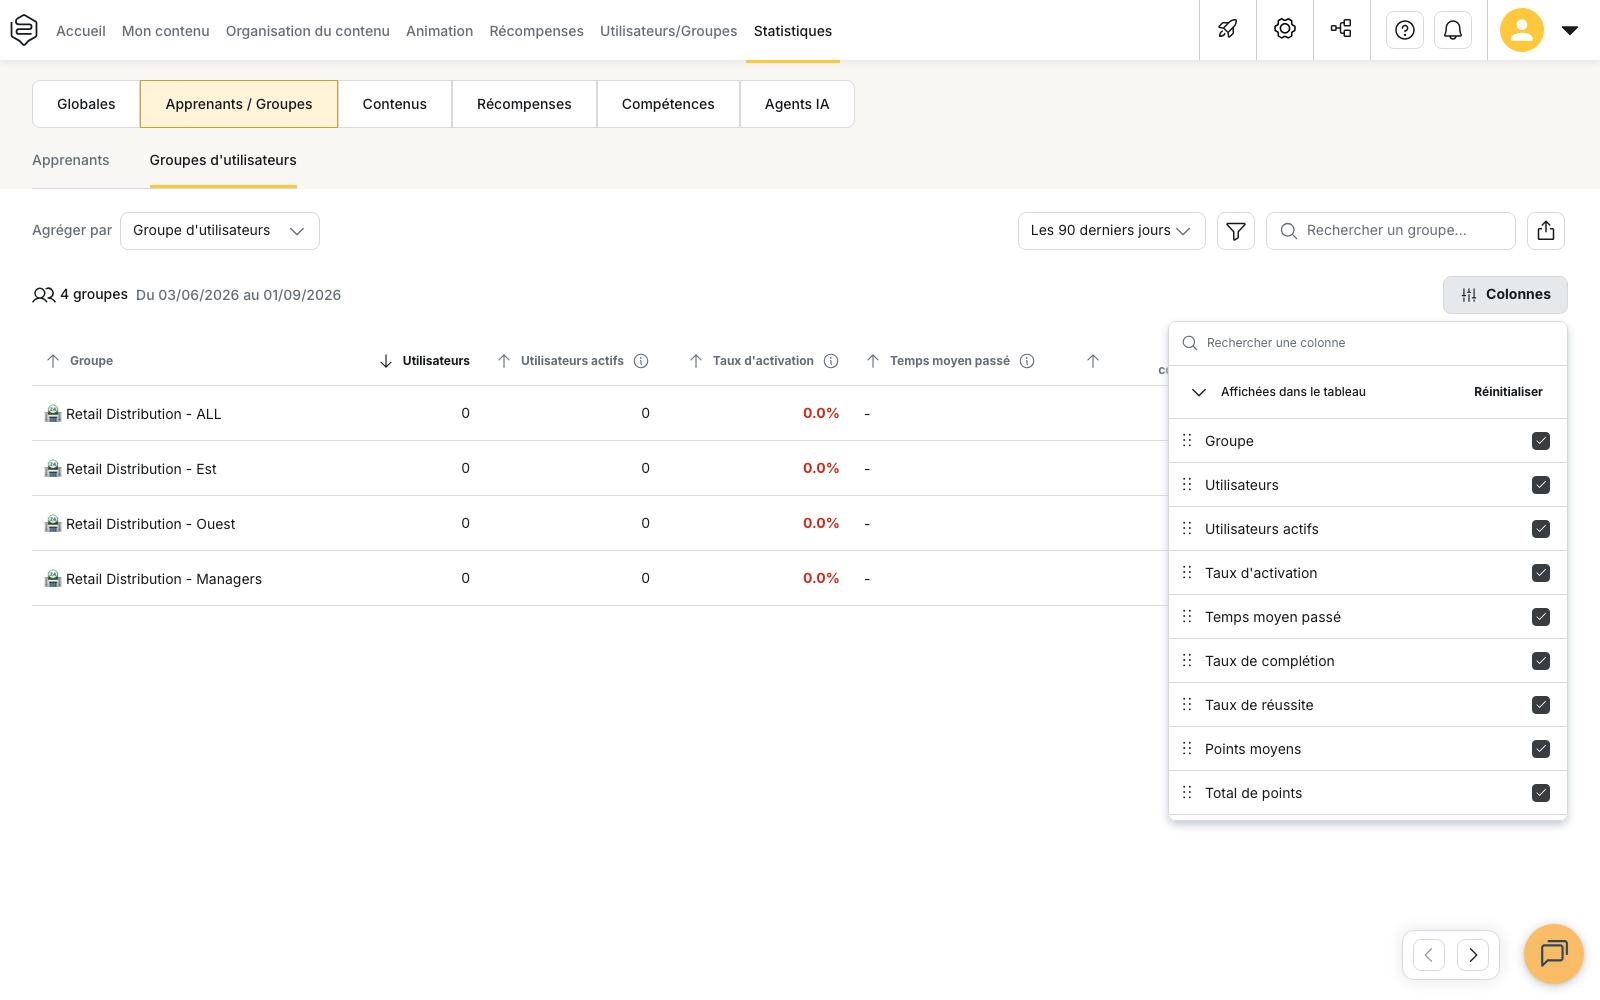
The Columns button opens the list of available columns.
The Displayed in table section contains the columns currently shown. Clear a column to remove it, or select another one to add it. Use the search field to find a column by name, and Reset to restore the default columns.
By default, the Learners sub-tab displays a comprehensive set of columns covering several types of information:
- learner identity: Alias, Email, First name, Last name, Login;
- general activity: Time spent, Points - Global, Points - Current period, Last login;
- capsule progress: Capsules started, Distinct capsules started, Capsules completed, Capsules passed, Distinct capsules passed;
- main success indicators: Completion rate - Unique, Completion rate - Global, Success rate - Global;
- other activity: Tips, Battles, created content, comments and Certificates obtained.
Additional columns are available from Columns but are hidden by default. These include the technical identifier, account creation date, detailed learning time, language, status and AI Agent indicators.
💡 Tip: before exporting, hide any columns you do not need. The generated file only includes the columns currently displayed, which reduces the amount of editing required afterwards.
Click a learner’s row to open their detailed profile.
View group statistics
The User groups sub-tab displays one row per group.
By default, the table includes the following columns: Group, Users, Active users, Activation rate, Total time spent, Average time spent, Completion rate, Success rate, Average points and Total points.
Active users corresponds to the number of learners who started at least one capsule, tip or battle during the selected period. The Activation rate compares this number with the total number of learners in the group.
⚠️ Average time spent and Average points are calculated across all learners in the group, not only active learners. A group containing inactive learners may therefore have lower averages.
Click a row to display the learners in the selected group. The corresponding filter is applied automatically.
The Group by selector lets you group the data by a custom field instead of by group. The first column of the table then uses the name of the selected field.
Use the available filters
The filter panel lets you narrow down the data using several criteria:
- Department;
- Period;
- Groups;
- Include deactivated learners;
- an option that restricts the results to learners from the department you are currently working in;
- Advanced filters based on the available columns.
To learn more about how these filters work, see Filters and audiences.
⚠️ Include deactivated learners does more than change the number of rows displayed. In the User groups sub-tab, this option also affects the calculation of the Activation rate, Average time spent and Average points.
Open a learner profile
A learner profile is organized into several tabs: General, Access, Session registrations, Statistics, Certificates, Messages / Notifications, Distributed documents and, for relevant accounts, Synchronization.
The Access tab lets you check exactly which content the learner can access. Its Groups, Capsules and Learning paths sub-tabs show which groups the learner belongs to and which content they can access.
They also make it easy to identify learners who do not belong to any group.
View a learner’s answer details
In a capsule’s statistics, click Answer details to review the learner’s answers question by question.
Use Filter by to choose which attempts to display:
- All attempts;
- Best attempt;
- Latest attempt;
- a specific attempt, identified by its date and score.
Edit a learner’s results
The Edit results action lets you manually validate one or more answers for the selected attempt.
This can be useful, for example, when a question is incorrect or ambiguous and you do not want to ask the learner to retake the entire capsule.
⚠️ Be careful when editing results for regulatory or compliance-related content. The platform stores the updated result, but not the reason why the correction was made.
Learn more
- What does each indicator measure?: understand exactly how completion and success are calculated, and the difference between Unique and Global indicators.
- Common issues: statistics: understand why the same indicator may display different values depending on the table you are viewing.
- Who can see which statistics?: understand how permissions and their scope affect the data available to each administrator.
- Content statistics: analyse statistics by content and understand how the Include learners without access option works.